# Model
## Node Properties Tabs
Pyplan structures code using an influence diagram of nodes. When a node is selected (on Edit mode), a Properties window opens. Nodes attributes can be inspected and edited by means of tabs that are labeled as Properties, Code, and Docs.
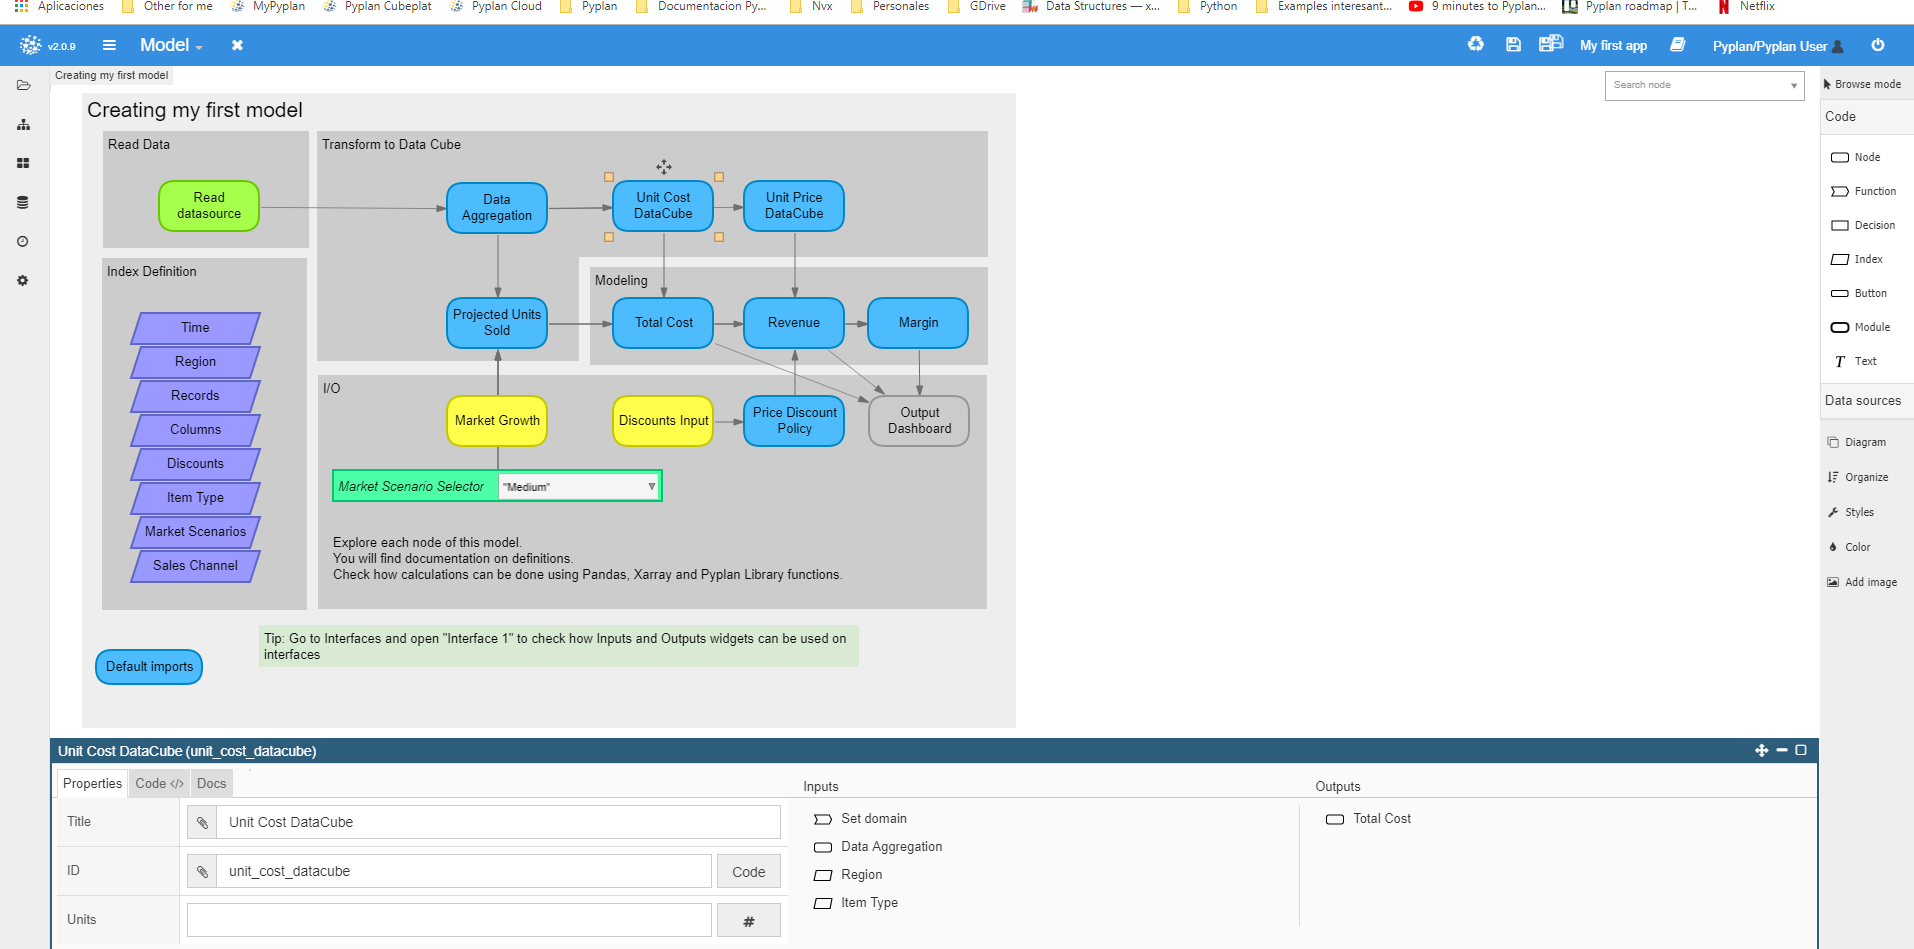
The Properties tab contains:
- **Title**: the legend that will be displayed over the node.
- **ID**: the node identification. The way to call the node values when coding.
- **Units**: a text value that will be displayed next to the title when evaluating a node.
- **#**: the number format of the node.
- **Inputs/Outputs**: lists of nodes titles directly linked to the selected node. You can navigate to any of them by clicking on the node name.
- **Code**: shortcut to the Code tab.
The Code tab:
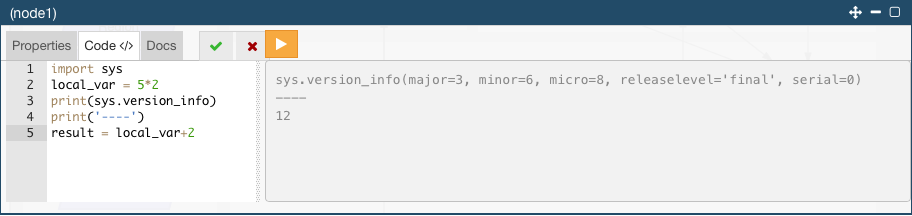
The Code tab presents two windows: the left one is where the code of the node is inserted.
Nodes' code **must end with the result definition**. The **"result"** variable contains the output of the node, i.e., the values that will be displayed when the node is evaluated or called from other node.
Intermediate local variables can be used within the node code. These local variables can be printed in the console for tracing calculation, but the result definition must be placed at the end.
The right-side window displays the console output. The outputs of any `print()` statement will be displayed here.
When the code is modified, a check and a cancel box appear, and the Play button turns orange to indicate the node needs to be run.
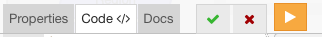
You can accept changes and run the node by pressing Ctrl + Enter or by clicking on the icons.
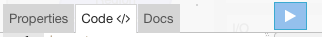
After running the node, the Play button turns blue to indicate it has already been calculated.
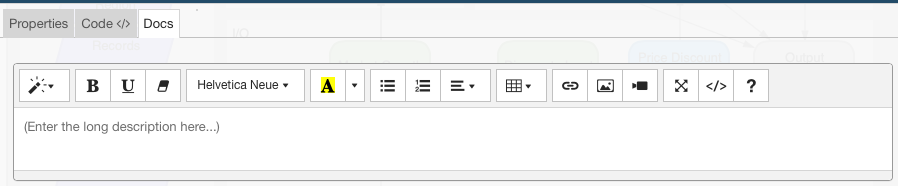
The Docs tab:
This tab contains a complete HTML text editor to include rich text, links, images, and videos that describe and explain the fundamentals of every calculation step. This way, the app becomes an interactive knowledge repository.
## Types of Nodes
The main elements for creating the app calculation logic are the following:
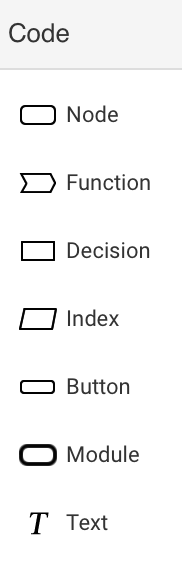 ### Node
It is the main element for creating the calculation logic. It can be understood as a global variable for programming, and its definition ends by indicating the output value of the variable as follows:
localvar = 5
result = 'this is the output:' + str(localvar*2)
### Function
This element is used for creating user-defined functions.
Below is a basic example of a UDF definition:
def _fn(param1,param2):
return param1+param2
result = _fn
Functions can be globally used in the entire model, and custom libraries can be created by grouping functions inside a module for later export and import.
### Decision
A decision node is meant to create a set of options from which the model user can choose.
Its definition syntax is:
result = selector(['A','B','C'],1,False)
where the first parameter is the list of values to choose from, the second is the position of the list chosen, and the third is a flag to indicate the multiple selection option.
### Index
[Xarray data structure](http://xarray.pydata.org/en/stable/data-structures.html) is Xarray’s implementation of a labeled, multi-dimensional array. It has several key properties:
- `values`: a [`numpy.ndarray`](https://docs.scipy.org/doc/numpy/reference/generated/numpy.ndarray.html#numpy.ndarray "(in NumPy v1.16)") holding the array’s values
- `dims`: dimension names for each axis (e.g., `('x', 'y', 'z')`)
- `coords`: a dict-like container of arrays (_coordinates_) that label each point (e.g., 1-dimensional arrays of numbers, datetime objects or strings)
The Pyplan index node is defined as a Pandas index to help operate with the Xarray matrix.
To define the index, the dims and coords properties are set simultaneously. Dim is defined as the Id property of the index, and Coords as the elements of the index.
Creating and working with the index in this way guarantees the possibility to operate in the matrix's domain. So for example, when you add two matrixes that share an index, the values are defined for all elements of the index. Working with Xarray native dims and coords does not guarantee that, because you could be operating with matrixes that even though they share a dimension, the coords domains do not intersect.
Indexes defined in Pyplan have an additional function when creating User Interfaces. When more than one Xarray output node share a dimension, inserting that dimension in the interface will work as a coordinated filter on all objects that share that dimension.
### Button
A button is created to run the scripts that use the model.
Any custom task, for example assigning a value or definition to a node, can be executed by running a button. Unlike nodes, its definition does not require the `result = ` sentence at the end, since there is no result to be stored.
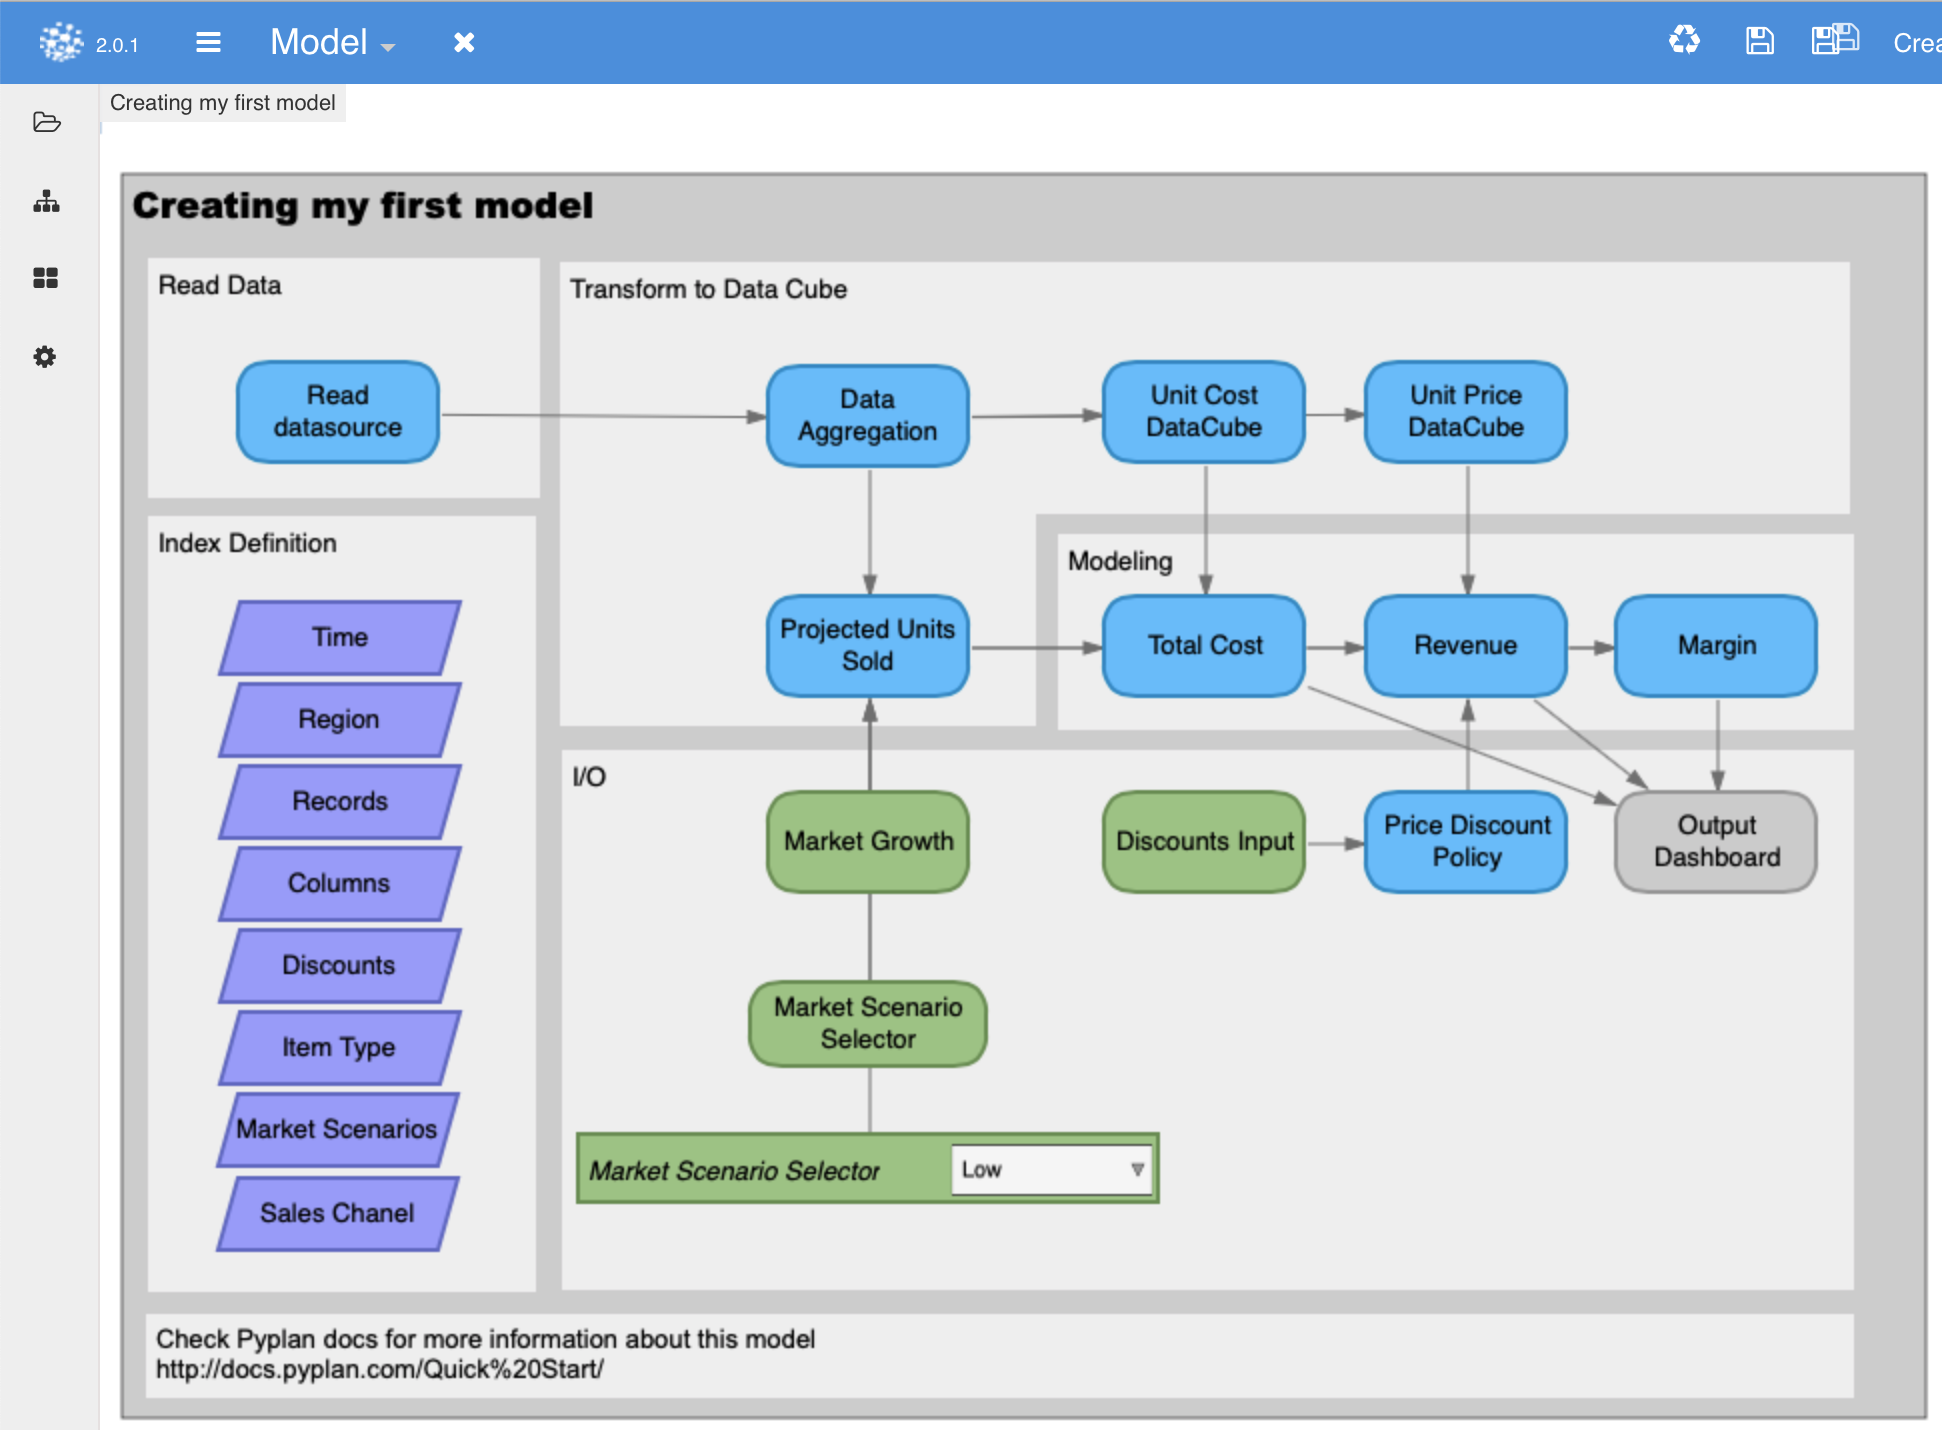
### Module
Modules are the containers of diagrams (workflows of nodes.) You can access a module by double clicking on it. The module navigation path is shown at the top of the digram. You can navigate directly to the level you want to access by clicking on it.
You can drag a group of selected nodes into a module to organize your diagram or cut and paste a group in case you want to move upstream.
### Text
The text node is intended for clarification of the calculation logic.
Its properties include text size, which can be adjusted by selecting the text; Z position, which allows to bring the selection to the front or send it to the back; and text font type and size, as well as border and background color.
## Model Preferences
### Default imports
In order to avoid declaring the "Import" sentence in each node, there is a node, called Default imports, which collects the libraries that will not require to declare import all across the model.
import numpy, pandas, cubepy, xarray
#fill the following dict keys with the alias you need to import in each node
result = {
"np":numpy,
"pd":pandas,
"cubepy":cubepy,
"xr":xarray}
## Using Python Libraries
Pyplan includes a function called "install_library" to help you work with libraries that are not natively included in the Pyplan app.
The syntax of such function is shown below:
install_library( pypi_name, import_name=None)
The second parameter is for cases where the pip install name is different than the name used for importing.
You can define a node as:
install_library( 'bokeh', import_name=None)
import 'bokeh'
result = bokeh.__version
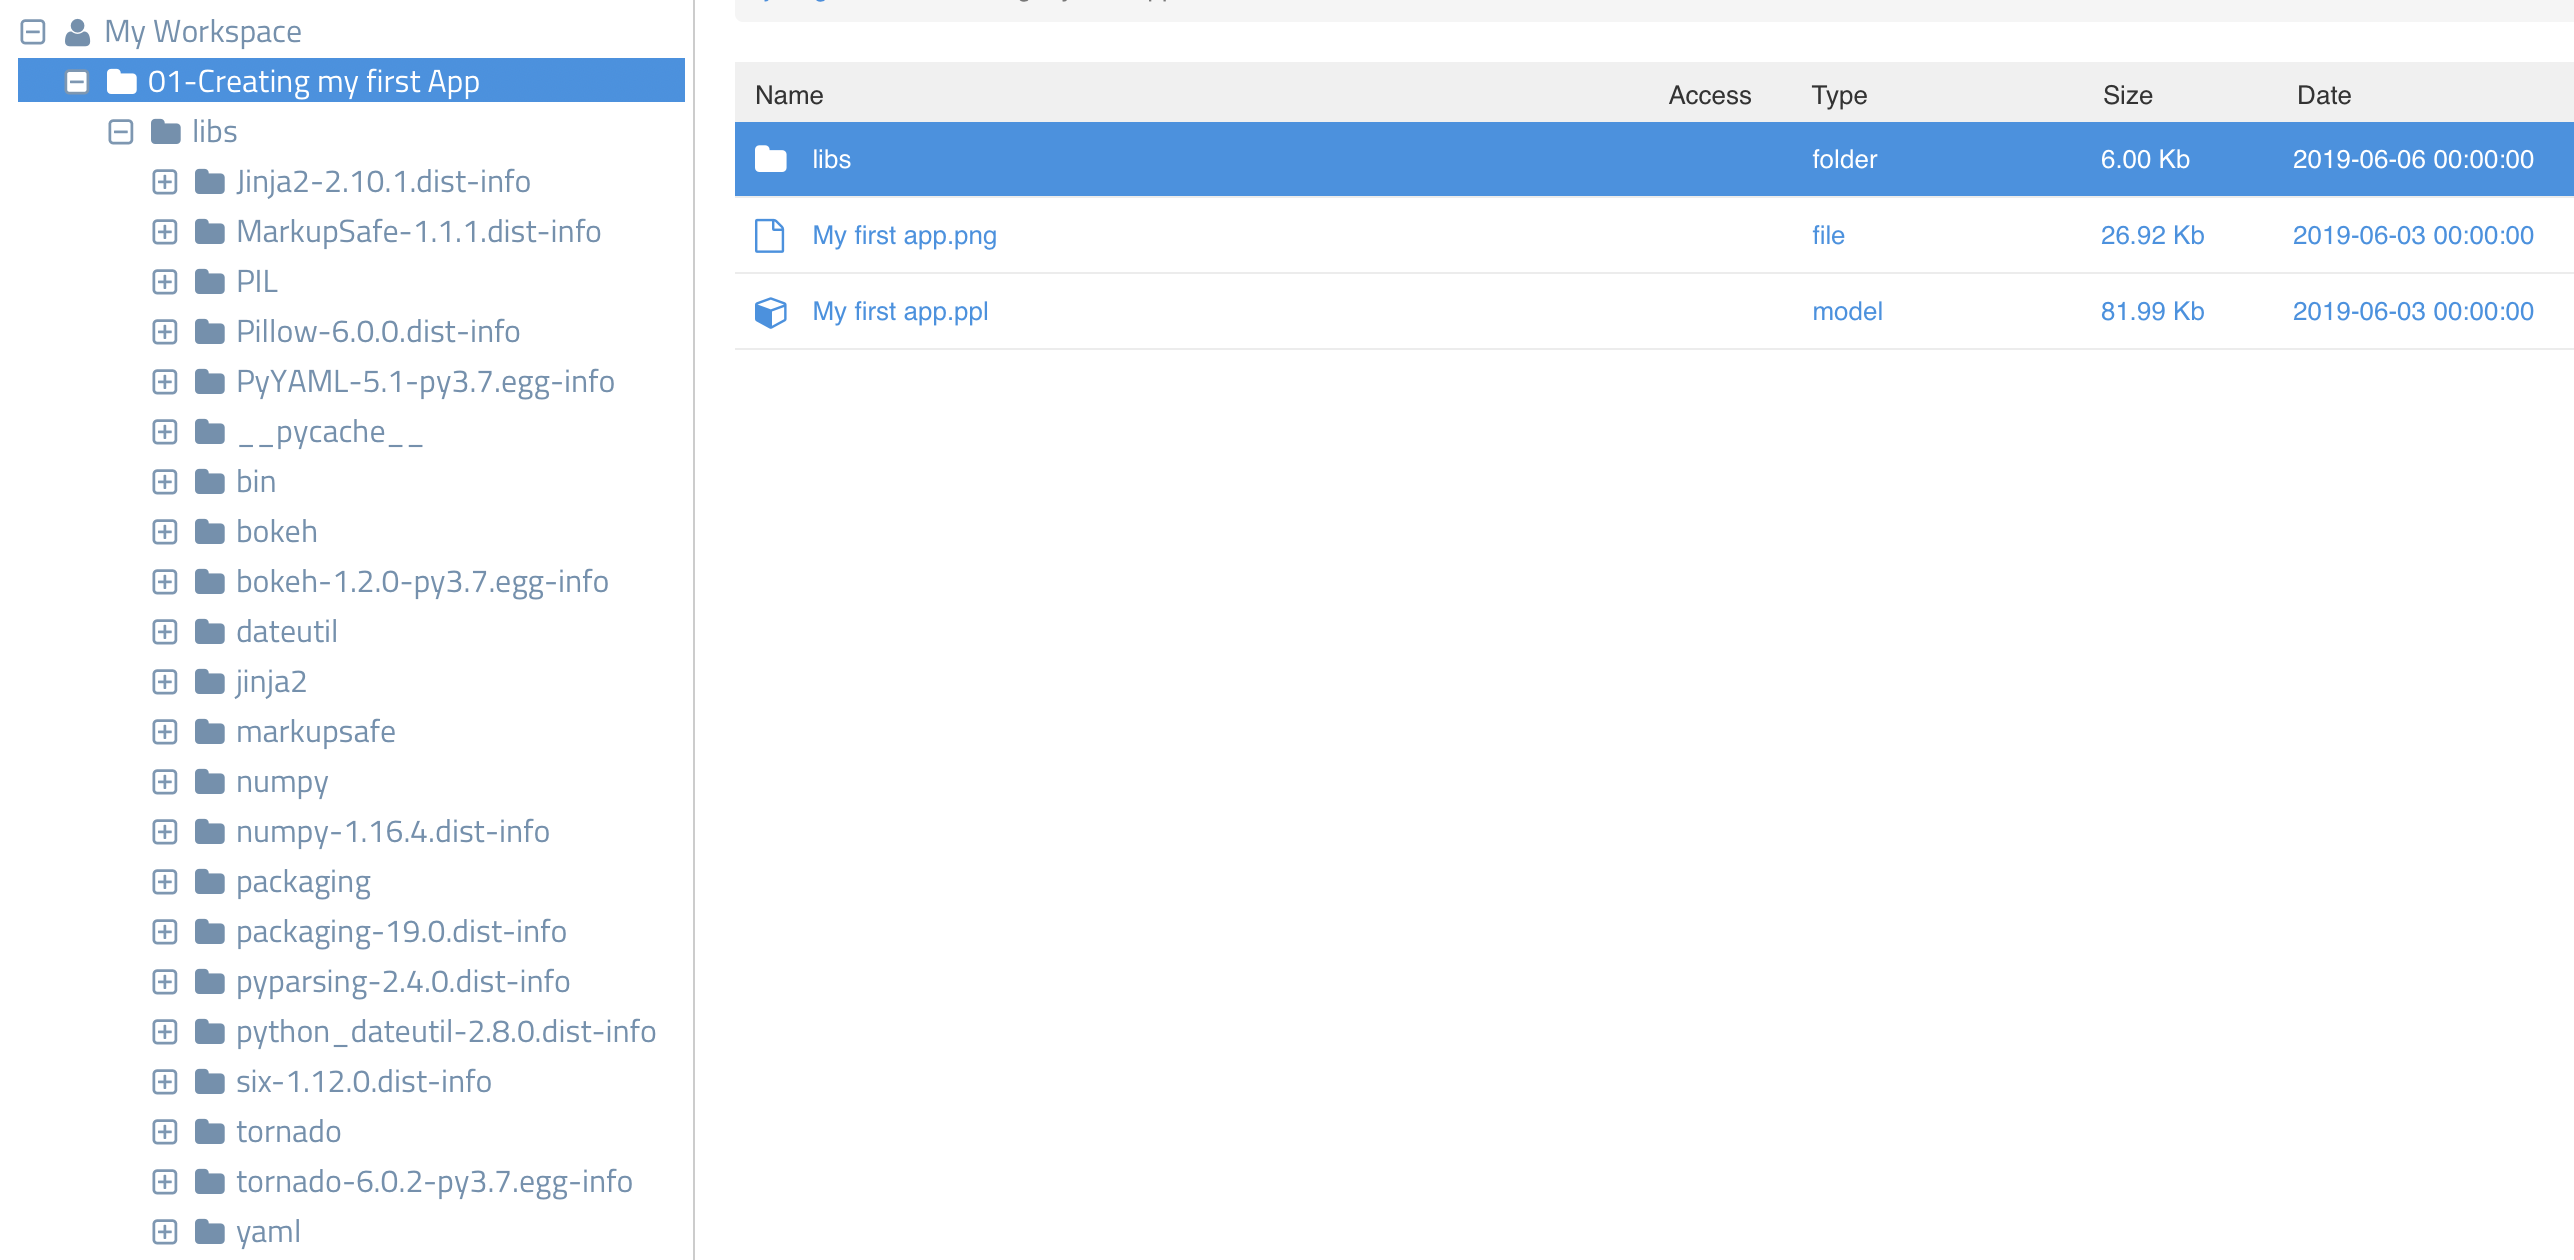
When a node with such definition is run for the first time, the mentioned library will be installed in a folder inside in the folder where the model is saved. A new folder named `libs` will be created and all library components will be installed in that folder.
The image below shows the result of installing the [Bokeh](https://bokeh.pydata.org/en/latest/) visualization library:
install_library( 'bokeh', import_name=None )
When the library is already installed the `install_library` function realize about that fact and does nothing.
Once installed you could delete the `install_library` sentence and the model will keep running, but it is good practice to keep this line because when you share the model or copy it to a different place, when running for the first time in that environment it will proceed again with the required installment.
Additionally, you must consider to include the library in the "Default Import" node to avoid the `import` sentence in every node you use the library.
## Toolboxes
Toolboxes are nodes for specific purposes, with custom wizards associated to them, which help parametrize a function for producing certain result.
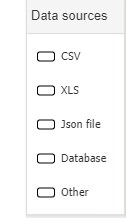
Pyplan includes a toolbox named Data Sources. An example of this wizard has been developed with the read CSV node.
This is an experimental feature. Further development of toolboxes will be mainly driven by Pyplan users' requests.
## Shortcuts
Shortcuts are very useful when modelling.
Take a look at shortcuts available on Pyplan on the following chart.
|Keys (PC)|(Mac OS)|Action|
|-----------|-----------|-----------|
|Shift + Click ||Select node|
|Shift + area|Shift + area|Select node area|
|Delete|Delete |Delete node|
|Ctrl + ←|Ctrl + Cmd + ←|Align left|
|Ctrl + →|Ctrl + Cmd + →|Align right|
|Ctrl + down|Ctrl + Cmd + down |Align bottom edge|
|Ctrl + up|Ctrl + Cmd + up |Align top edge|
|Ctrl + F|Ctrl + F |Search node|
|Ctrl + S|Ctrl + S |Save current model|
|Ctrl + H|Ctrl + H|From a selected alias node go to the original|
|Ctrl + R|Ctrl + R|Evaluate node|
|Ctrl + Y|Ctrl + Y|Alternated displaying nodes Title / ID|
| Ctrl + Click|Option + Click|Insert node Id in other node definition|
|Ctrl + space|Ctrl + space |Autofill formulas|
|Ctrl + B|Ctrl + B |Edit node number format|
|Ctrl + C|Ctrl + C |Copy node|
|Ctrl + X|Ctrl + X |Cut node|
|Ctrl + V|Ctrl + V |Paste node|
|Ctrl + M|Ctrl + M |Create alias|
|Ctrl + D|Ctrl + D |Duplicate node|
|Ctrl + G|Ctrl + G |Same height|
|Ctrl + I|Ctrl + I|Same width|
|Ctrl + Alt + 0|Ctrl + Option + 0|Same size|
|Ctrl + Enter|Cmd + Enter|Evaluate node and show console output|
|Ctrl + E|Ctrl + E|Evaluate and Explore node properties|
|Ctrl + A|Ctrl + A |Select all items from PivotGrid and influence diagram|
|Ctrl + Alt + O||New output|
|Ctrl + Alt + I|Ctrl + Opt + Cmd + I|New input|
|Ctrl + Alt + D|Ctrl + Opt + D|Go to influence diagram|
|Mouse Wheel||Move the diagram up/down|
|Alt + Mouse Wheel||Move the diagram left/right|
|Ctrl + Mouse Wheel||Increase/reduce node size|
|Ctrl + Shift +H|Ctrl + Shift +H|Go back to the last level when navigating the modules in the diagram|
|Ctrl + Q|Ctrl + Q|Go one level up|
|Ctrl + Shift + C||Copy PivotGrid with format|
|Ctrl + F (in dock)|Cmd + F (in dock)|Search/ change key|
|Ctrl + 1 (in dock)|Ctrl + 1 (in dock)|Move to properties window|
|Ctrl + 2 (in dock)|Ctrl + 2 (in dock)|Move to code window|
|Ctrl + 3 (in dock)|Ctrl + 3 (in dock)|Move to docs window|
Take advantaged of these to increase coding speed.
### Node
It is the main element for creating the calculation logic. It can be understood as a global variable for programming, and its definition ends by indicating the output value of the variable as follows:
localvar = 5
result = 'this is the output:' + str(localvar*2)
### Function
This element is used for creating user-defined functions.
Below is a basic example of a UDF definition:
def _fn(param1,param2):
return param1+param2
result = _fn
Functions can be globally used in the entire model, and custom libraries can be created by grouping functions inside a module for later export and import.
### Decision
A decision node is meant to create a set of options from which the model user can choose.
Its definition syntax is:
result = selector(['A','B','C'],1,False)
where the first parameter is the list of values to choose from, the second is the position of the list chosen, and the third is a flag to indicate the multiple selection option.
### Index
[Xarray data structure](http://xarray.pydata.org/en/stable/data-structures.html) is Xarray’s implementation of a labeled, multi-dimensional array. It has several key properties:
- `values`: a [`numpy.ndarray`](https://docs.scipy.org/doc/numpy/reference/generated/numpy.ndarray.html#numpy.ndarray "(in NumPy v1.16)") holding the array’s values
- `dims`: dimension names for each axis (e.g., `('x', 'y', 'z')`)
- `coords`: a dict-like container of arrays (_coordinates_) that label each point (e.g., 1-dimensional arrays of numbers, datetime objects or strings)
The Pyplan index node is defined as a Pandas index to help operate with the Xarray matrix.
To define the index, the dims and coords properties are set simultaneously. Dim is defined as the Id property of the index, and Coords as the elements of the index.
Creating and working with the index in this way guarantees the possibility to operate in the matrix's domain. So for example, when you add two matrixes that share an index, the values are defined for all elements of the index. Working with Xarray native dims and coords does not guarantee that, because you could be operating with matrixes that even though they share a dimension, the coords domains do not intersect.
Indexes defined in Pyplan have an additional function when creating User Interfaces. When more than one Xarray output node share a dimension, inserting that dimension in the interface will work as a coordinated filter on all objects that share that dimension.
### Button
A button is created to run the scripts that use the model.
Any custom task, for example assigning a value or definition to a node, can be executed by running a button. Unlike nodes, its definition does not require the `result = ` sentence at the end, since there is no result to be stored.
### Module
Modules are the containers of diagrams (workflows of nodes.) You can access a module by double clicking on it. The module navigation path is shown at the top of the digram. You can navigate directly to the level you want to access by clicking on it.
You can drag a group of selected nodes into a module to organize your diagram or cut and paste a group in case you want to move upstream.
### Text
The text node is intended for clarification of the calculation logic.
Its properties include text size, which can be adjusted by selecting the text; Z position, which allows to bring the selection to the front or send it to the back; and text font type and size, as well as border and background color.

## Model Preferences
### Default imports
In order to avoid declaring the "Import" sentence in each node, there is a node, called Default imports, which collects the libraries that will not require to declare import all across the model.
import numpy, pandas, cubepy, xarray
#fill the following dict keys with the alias you need to import in each node
result = {
"np":numpy,
"pd":pandas,
"cubepy":cubepy,
"xr":xarray}
## Using Python Libraries
Pyplan includes a function called "install_library" to help you work with libraries that are not natively included in the Pyplan app.
The syntax of such function is shown below:
install_library( pypi_name, import_name=None)
The second parameter is for cases where the pip install name is different than the name used for importing.
You can define a node as:
install_library( 'bokeh', import_name=None)
import 'bokeh'
result = bokeh.__version
When a node with such definition is run for the first time, the mentioned library will be installed in a folder inside in the folder where the model is saved. A new folder named `libs` will be created and all library components will be installed in that folder.
The image below shows the result of installing the [Bokeh](https://bokeh.pydata.org/en/latest/) visualization library:
install_library( 'bokeh', import_name=None )

When the library is already installed the `install_library` function realize about that fact and does nothing.
Once installed you could delete the `install_library` sentence and the model will keep running, but it is good practice to keep this line because when you share the model or copy it to a different place, when running for the first time in that environment it will proceed again with the required installment.
Additionally, you must consider to include the library in the "Default Import" node to avoid the `import` sentence in every node you use the library.
## Toolboxes
Toolboxes are nodes for specific purposes, with custom wizards associated to them, which help parametrize a function for producing certain result.
Pyplan includes a toolbox named Data Sources. An example of this wizard has been developed with the read CSV node.
This is an experimental feature. Further development of toolboxes will be mainly driven by Pyplan users' requests.

## Shortcuts
Shortcuts are very useful when modelling.
Take a look at shortcuts available on Pyplan on the following chart.
|Keys (PC)|(Mac OS)|Action|
|-----------|-----------|-----------|
|Shift + Click ||Select node|
|Shift + area|Shift + area|Select node area|
|Delete|Delete |Delete node|
|Ctrl + ←|Ctrl + Cmd + ←|Align left|
|Ctrl + →|Ctrl + Cmd + →|Align right|
|Ctrl + down|Ctrl + Cmd + down |Align bottom edge|
|Ctrl + up|Ctrl + Cmd + up |Align top edge|
|Ctrl + F|Ctrl + F |Search node|
|Ctrl + S|Ctrl + S |Save current model|
|Ctrl + H|Ctrl + H|From a selected alias node go to the original|
|Ctrl + R|Ctrl + R|Evaluate node|
|Ctrl + Y|Ctrl + Y|Alternated displaying nodes Title / ID|
| Ctrl + Click|Option + Click|Insert node Id in other node definition|
|Ctrl + space|Ctrl + space |Autofill formulas|
|Ctrl + B|Ctrl + B |Edit node number format|
|Ctrl + C|Ctrl + C |Copy node|
|Ctrl + X|Ctrl + X |Cut node|
|Ctrl + V|Ctrl + V |Paste node|
|Ctrl + M|Ctrl + M |Create alias|
|Ctrl + D|Ctrl + D |Duplicate node|
|Ctrl + G|Ctrl + G |Same height|
|Ctrl + I|Ctrl + I|Same width|
|Ctrl + Alt + 0|Ctrl + Option + 0|Same size|
|Ctrl + Enter|Cmd + Enter|Evaluate node and show console output|
|Ctrl + E|Ctrl + E|Evaluate and Explore node properties|
|Ctrl + A|Ctrl + A |Select all items from PivotGrid and influence diagram|
|Ctrl + Alt + O||New output|
|Ctrl + Alt + I|Ctrl + Opt + Cmd + I|New input|
|Ctrl + Alt + D|Ctrl + Opt + D|Go to influence diagram|
|Mouse Wheel||Move the diagram up/down|
|Alt + Mouse Wheel||Move the diagram left/right|
|Ctrl + Mouse Wheel||Increase/reduce node size|
|Ctrl + Shift +H|Ctrl + Shift +H|Go back to the last level when navigating the modules in the diagram|
|Ctrl + Q|Ctrl + Q|Go one level up|
|Ctrl + Shift + C||Copy PivotGrid with format|
|Ctrl + F (in dock)|Cmd + F (in dock)|Search/ change key|
|Ctrl + 1 (in dock)|Ctrl + 1 (in dock)|Move to properties window|
|Ctrl + 2 (in dock)|Ctrl + 2 (in dock)|Move to code window|
|Ctrl + 3 (in dock)|Ctrl + 3 (in dock)|Move to docs window|
Take advantaged of these to increase coding speed.